Situation Analysis
The company designs and produces products for aerospace industrial applications.
The company has a great reputation in the marketplace.
Since the acquisition, achieving on time delivery (OTD), increasing market share and lowering manufacturing costs have become part of the business strategy.
The company had not sit idle in terms of The systematic and continuous elimination of waste of capital, material and people’s time.continuous improvement and had accomplished some excellent gains in productivity in the pre-buy time frame. The mission was to build on these gains and go to the next level of a lean enterprise.
This included:
- Training and coaching of the workforce at all levels
- Establishing expectations
- Setting a one to two year lean implementation strategy
Solution
In walking thru the facility, it was obvious that two things needed to occur:
1. The facility needed to go thru a 5S exercise.

The senior management supported this effort and the employees in partnership with management, started the this process two days after training. A red tag area was established and over 7 “hoppers” of unneeded material were removed from the floor.
These types of activities show commitment to the organization in both resources and time and sends a clear message that the lean initiative is real and will become the way we do business. This activity freed up 25% of the floor space in the area where we wanted to establish our first cell.
2. Design a “one piece flow” cell
Once the area succeeded in round one of the 5S application, a team was formed to design the first [tooltip tip=”The optimal supply of material maintained to satisfy customer demand.”]one piece flow[/tooltip] cell. The goals for the cell were established, the product family was process mapped, a process matrix was completed and each process was video taped. The team established the [tooltip tip=”Total daily available time / total daily customer demand”]Takt[/tooltip] time requirement and time observations were completed by the viewing the video tapes.
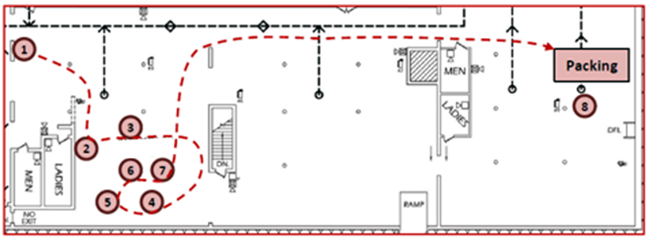
- Part travel – 339 feet
- Space – 1502 square feet
- Throughput (from raw material to pack) = (On Average) 5 days for 100 pieces
- Average work in process – 7200 pieces
- Average order – 100 – 200 pieces
From the time observation forms, the team was able to make the operational bar charts and operator percent load charts to compare against Takt time. The team was also able to sketch out the preliminary cell design.
Utilizing the operational load charts coupled with the operator load charts, the team calculated the number of employees needed and their standard work sequence. At this point the layout was agreed upon and the equipment was moved into place.
From the time observation forms and the videos, the team drove out the worst sin of the eight process wastes: over production. By establishing [tooltip tip=”Signal system used in a pull system.”]kanban[/tooltip] visuals at the select work stations and establishing [tooltip tip=”The optimal supply of material maintained to satisfy customer demand.”]one piece flow[/tooltip], overproduction was avoided. Also observed in the videos was the waste of motion by the worker in terms of location and reaching for assembly parts that are required at the assembly machines or stations.
The team designed, fabricated, located and installed these part introduction containers for the stations that required parts. This action that took out the waste of motion solved ergonomic problems and increased the [tooltip tip=”Work that really counts, productive work, work that directly contributed to the purpose and improvement of the organization.”]value added[/tooltip] time of that step. This design of part containers also allows for the correct amount of [tooltip tip=”number of pieces and their placement at workstations to maintain optimal flow.”]standard work in process[/tooltip], lowering the cost of work in process inventory, but also provided a fast [tooltip tip=”A Japanese production method in which work is managed by data display and visible indicators of procedures, processes and results.”]visual control[/tooltip] to line management and production assistants in terms of keeping the line primed with parts. This visual will also serve as the [tooltip tip=”Signal system used in a pull system.”]kanban[/tooltip] signal to the upstream producer as well.
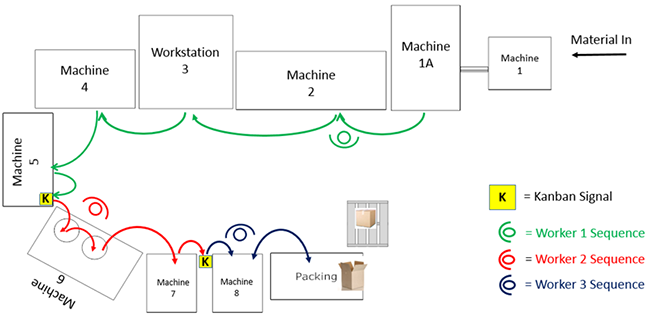
- Part travel – 34 feet
- Space – 126 square feet
- Throughput (from raw material to Pack) = (One Piece) every 60 seconds or 60 parts/hour
- Average work in process – 430 Pieces
- Average order: 100 – 200 Pieces
Quality requirements were established into the cell. One of the benefits of a cellular manufacturing is that quality issues can be caught early. In the old way, workers would batched 50 to 100 parts before moving them to the next operation. The risk in this is that parts that have a quality issue would not be caught until a batch of parts made it to:
- The next process
- Shipping
- The customer.
When the cell ran on the first day, a quality problem was identified and the cell stopped. At this point, only two parts had been made.
Secondly, and simply because they are now a team and not individual contributors, the part quality has increased because they are more focused as a team, looking at the parts more than they ever would in batch production mode. The team is communicating issues instantaneously in real time and fixing issues on the spot. The team implemented an hour by hour chart at the end of the cell to track productivity and line stoppage issues.
Cultural Challenge
In my and in the team’s observations, from both being on the shop floor and of analyzing the videos, the workers were in a [tooltip tip=”The production control methods whereby product is built in lots determined by present and anticipated needs, or as determined by the economic lot size formula, and in all cases determined by what is needed to overcome hidden and/or visible problems.”]batch production[/tooltip] mode. As a result they were working one machine or workstation in the process of making these parts. They were sitting in chairs the entire day for the most part.
Result
In the new cell design the chairs no longer exist, the cell members have to behave as a team and they have to follow the stand work sequences. This was a huge change for these workers.
The employees in this case took on these challenges and exceeded all our expectations. Not only did they follow the standard work sequence but improved the cell on their own after running it for two days. They also decided to switch positions after two hours to help relieve repetitive tasks, upgrade their level, and facilitate change.
The comments from the team were that the day went by quicker, they felt that the removal of the chairs was not an issue, and they were not tired or stressed. Involvement, coaching, taking care of the ergonomic issues such as part placement, equipment redesign, and ergonomic floor matting, coupled with the support of the employees and management yielded fantastic results.
This cell is the start of what will make this company the world leader in speed, cost and quality in the market place.